This JavaScript based tool is developed along with paper "A Tool for Subjective and Interactive Visual Data Exploration"
We are now actively developing new features, you might find the actual user interface is slightly different from this intro.
In this paper, we introduce a novel generic method for interactive visual exploration of high-dimensional data. In contrast to most visualization tools, it is not based on the traditional dogma of manually zooming and rotating data. Instead, the tool initially presents the user with an 'interesting' projection of the data and then employs data randomization with constraints to allow users to flexibly and intuitively express their interests or beliefs using visual interactions that correspond to exactly defined constraints. These constraints expressed by the user are then taken into account by a projection-finding algorithm to compute a new 'interesting' projection, a process that can be iterated until the user runs out of time or finds that constraints explain everything she needs to find from the data.
The tool operates in the following way:
-
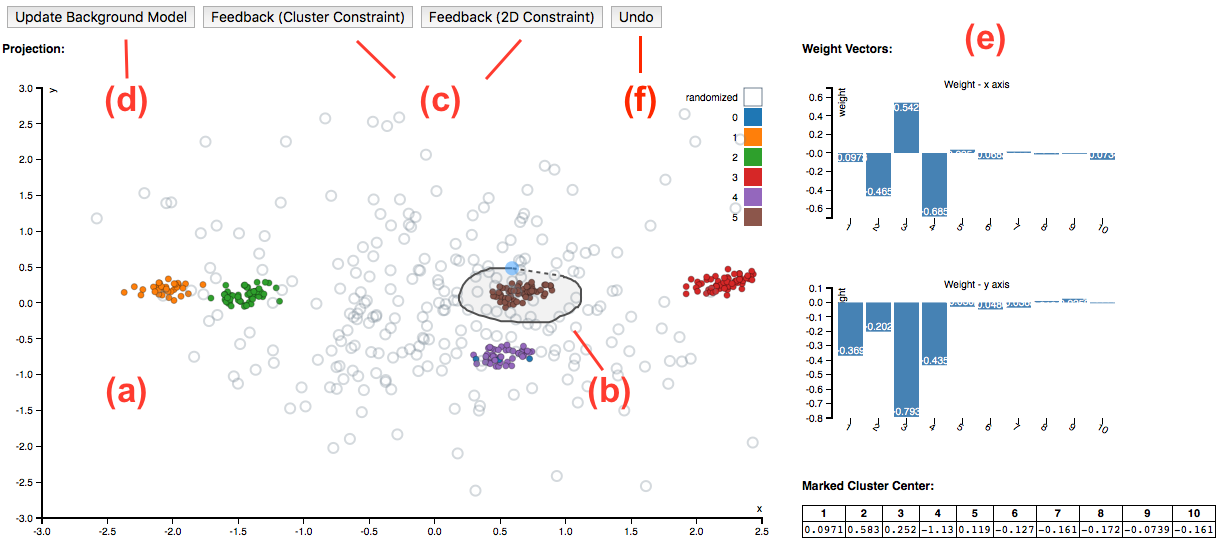
Step 1 The tool initially presents an 'interesting' projection of the data, visualized as a scatter plot (a). The the corresponding weight vectors of the projection is plotted in area (e).
-
Step 2 On investigating this scatter plot, mark patterns in the plot you found interesting by drawing a circle around them (b). Based on your confidence about the patterns, please submit the selected patterns as one of the two types of feedbacks (c): Cluster Constraint, 2D Constraint. You can find the the mean vector of the marked data points at the bottom of area (e). You can also press button (f) to undo the feedbacks.
-
Step 3 Once finished with feedback, press the button (d) to update the background model. The new model will reflects the newly assimilated information embodied by the patterns highlighted by the user. Then the most interesting projection with respect to this updated background model can be computed. Please follow Step 1 again to start the next iteration of exploring.
We present the tool by means of two case studies, one controlled study on synthetic data and another on real census data.
Synthetic Dataset Case Study
In this case study, user will operate on a sub-sample (250 data points) of a synthetic dataset. The Synthetic Dataset consisting of 1000 10-dimensional data vectors of which dimensions 1-4 can be clustered into five clusters, dimensions 5-6 into four clusters involving different subsets of data points, and of which dimensions 7-10 are Gaussian noise. All dimensions have equal variance. The sub-sampled dataset is zscored. It takes about 20 seconds to load the case study.
UCI Adult Dataset Case Study
In this case study, user will use the tool to explore a real census dataset. The dataset is compiled from UCI Adult Dataset . It consists of 218 sub-sampled data points and nine attributes: "Age" (integer, 17-19), "Education" (integer, 1-16), "HoursPerWeek" (integer, 1-99), "EG_White" (binary, {"No" = 0, "Yes" = 1}), "EG_AsianPacIlander" (binary), EG_Black" (binary), "EG_Other" (binary), "Gender" (binary, {"Female" = 0, "Male" = 1}), and "Income" (binary, {"<50k" = 0, ">50k" = 1}), where "EG_" stands for "Ethnic Group". The sub-sampled dataset is zscored. It takes about 15 seconds to load the case study.